| Sales | Rents | ||||||||
| 2021 | 2022 | 2023 | 2021 | 2022 | 2023 | ||||
| Slovenia | |||||||||
| Number of contracts | 66 | 70 | 39 | 350 | 347 | 277 | |||
| Total sold/rented area | m2 | sum | 50.900 | 87.300 | 35.300 | 211.500 | 247.800 | 202.200 | |
| €/m2 | 1.quartile | 251 | 268 | 382 | 2,7 | 3,0 | 3,6 | ||
| Sales prices / Rents | €/m2 | median | 455 | 456 | 605 | 4,0 | 4,5 | 5,0 | |
| €/m2 | 3.quartile | 639 | 741 | 975 | 5,5 | 5,9 | 7,4 | ||
| Area | m2 | median | 472 | 470 | 197 | 158,0 | 210,0 | 193,0 | |
| Year of construction | year | median | 1980 | 1978 | 1977 | 1973 | 1970 | 1970 | |
| Annual growth | 10% | ||||||||
|
Ljubljana |
|||||||||
| Number of contracts | 7 | 4 | 4 | 86 | 98 | 114 | |||
| Total sold/rented area | m2 | sum | 3.100 | 1.200 | 3.200 | 34.700 | 42.300 | 33.000 | |
| €/m2 | 1.quartile | 524 | 401 | 948 | 4,7 | 5,2 | 5,1 | ||
| Sales prices / Rents | €/m2 | median | 615 | 448 | 987 | 5,1 | 6,0 | 6,5 | |
| €/m2 | 3.quartile | 1.219 | 551 | 1.143 | 7,0 | 7,2 | 8,7 | ||
| Area | m2 | median | 334 | 166 | 254 | 117 | 121 | 98 | |
| Year of construction | year | median | 1973 | 1969 | 1983 | 1970 | 1970 | 1970 | |
|
Maribor |
|||||||||
| Number of contracts | 5 | 6 | 1 | 26 | 37 | 18 | |||
| Total sold/rented area | m2 | sum | 5.500 | 2.900 | 300 | 17.100 | 34.000 | 19.100 | |
| €/m2 | 1.quartile | 538 | 205 | 433 | 1,9 | 1,7 | 1,6 | ||
| Sales prices / Rents | €/m2 | median | 647 | 232 | 433 | 2,6 | 2,9 | 2,6 | |
| €/m2 | 3.quartile | 882 | 389 | 433 | 3,0 | 3,4 | 3,6 | ||
| Area | m2 | median | 873 | 384 | 300 | 330 | 545 | 356 | |
| Year of construction | year | median | 1980 | 1985 | 2000 | 1960 | 1960 | 1940 | |
|
Coastal Region |
|||||||||
| Number of contracts | 1 | 1 | - | 8 | 9 | 9 | |||
| Total sold/rented area | m2 | sum | 100 | 300 | - | 4.000 | 6.100 | 4.500 | |
| €/m2 | 1.quartile | 678 | 932 | - | 3,7 | 3,7 | 5,5 | ||
| Sales prices / Rents | €/m2 | median | 678 | 932 | - | 5,3 | 5,4 | 5,8 | |
| €/m2 | 3.quartile | 678 | 932 | - | 7,1 | 6,0 | 7,5 | ||
| Area | m2 | median | 123 | 295 | - | 119 | 698 | 348 | |
| Year of construction | year | median | 2000 | 1960 | - | 1980 | 1987 | 1980 | |
| Source: own calculation, Trgoskop | |||||||||
Sales
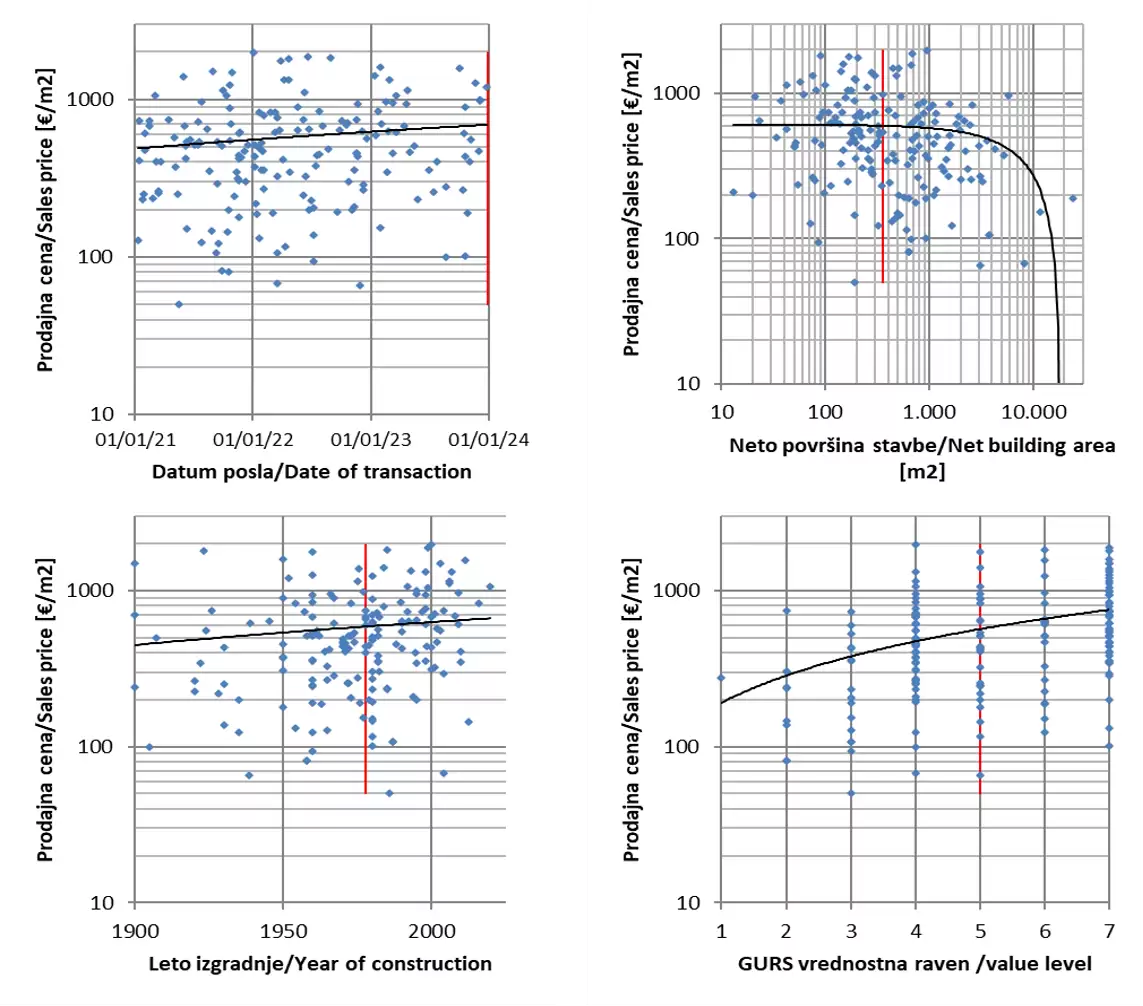
In Slovenia, there are approx. 50 recordes sales of industrial premises, mostly between 200 and 400m2 in size. Transactions fluctuates greatly from year to year. Transactions are mostly made with older objects (50 years). The median selling price of industrial premises is €605/m2, while in the previous year the median was €456/m2. Due to large fluctuations in the market, the prices are also very different, the reliability of the shown data is therefore low. Due to the variety of industrial real estate and the small number of transactions, the annual price growth rate is not possible to determine.
There were 5 transactions with industrial premises worth over €1 million in 2023, the largest of which was the sale of industrial premises measuring 2,620 m2 in Ljubljana (Agrokombinatska cesta 61A) at a price of €2.2 million. Larger deals in 2023 were also realized in Lendava, Logatec and Slovenj Gradec.
Rentals
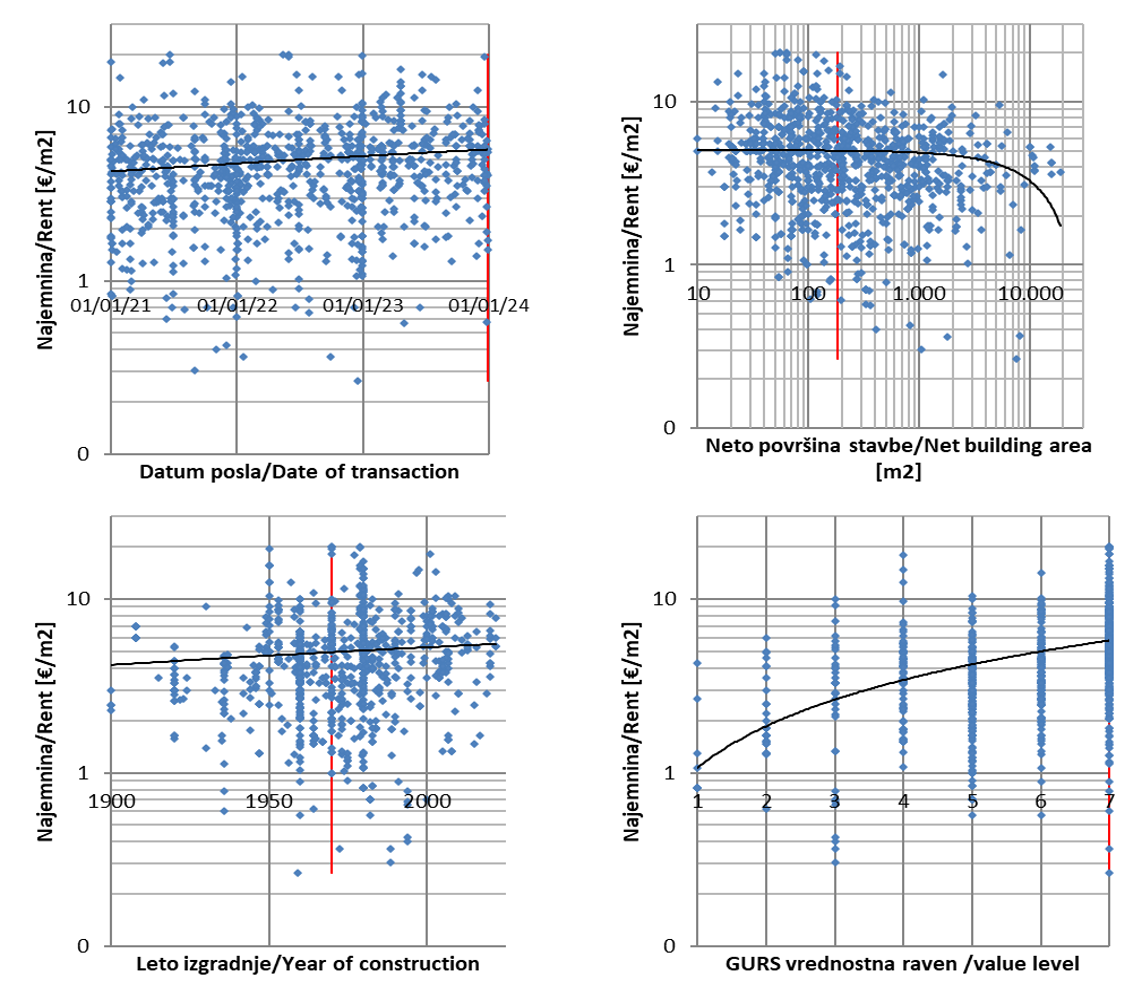
In Slovenia, approx. 300 rental contracts with industrial premises are recorded annually, mostly older (from 1970s) of approx. 200 m2 in size. Rent deals of industrial premises are evenly distributed throughout the country. The median rental price is €5/m2, the spread (1st and 3rd quartile) is from €3.6 to €7.4/m2. The highest rents are achieved in Ljubljana, in the vicinity of Ljubljana and on the coast, prices are significantly lower elsewhere. Rent growth in 2023 was 10%. Due to a lack of adequate data, it was not possible to statistically determine annuale price growth rate for 2022.
The largest industrial real estate rental deals in 2023 were realized in Grosuplje (15,820 m2 for rent at a price of €4.3/m2), Brezovica (5,254 m2 at a price of €9.6/m2) and Ajdovščina (10,755 m2 at a price of €4.5 /m2).
Graphical presentation of sales transactions
Graphical presentation of rental transactions