| Sales | Rents | ||||||||
| 2021 | 2022 | 2023 | 2021 | 2022 | 2023 | ||||
| Slovenia | |||||||||
| Number of contracts | 223 | 180 | 127 | 337 | 293 | 203 | |||
| Total sold/rented area | m2 | sum | 70.600 | 34.600 | 14.100 | 66.400 | 46.400 | 35.300 | |
| €/m2 | 1.quartile | 649 | 775 | 781 | 4,8 | 6,0 | 6,5 | ||
| Sales prices / Rents | €/m2 | median | 938 | 1.130 | 1.143 | 7,7 | 8,6 | 9,0 | |
| €/m2 | 3.quartile | 1.250 | 1.730 | 1.794 | 13,4 | 16,9 | 13,8 | ||
| Area | m2 | median | 71 | 61 | 71 | 64,0 | 55,5 | 58,0 | |
| Year of construction | year | median | 1988 | 1990 | 1980 | 1980 | 1980 | 1980 | |
| Annual growth | 9% | -4% | 6% | 6% | |||||
|
Ljubljana |
|||||||||
| Number of contracts | 28 | 37 | 30 | 84 | 87 | 54 | |||
| Total sold/rented area | m2 | sum | 2.700 | 4.300 | 2.600 | 10.600 | 15.400 | 5.200 | |
| €/m2 | 1.quartile | 1.026 | 1.452 | 1.398 | 7,1 | 8,5 | 8,5 | ||
| Sales prices / Rents | €/m2 | median | 1.446 | 1.838 | 1.810 | 15,2 | 16,9 | 12,8 | |
| €/m2 | 3.quartile | 1.864 | 2.955 | 2.575 | 23,0 | 19,1 | 19,7 | ||
| Area | m2 | median | 51 | 52 | 66 | 68 | 58 | 44 | |
| Year of construction | year | median | 1991,5 | 1990 | 1988 | 1972 | 1960 | 1969 | |
|
Maribor |
|||||||||
| Number of contracts | 24 | 14 | 12 | 32 | 24 | 16 | |||
| Total sold/rented area | m2 | sum | 3.100 | 2.100 | 1.300 | 5.300 | 6.600 | 8.100 | |
| €/m2 | 1.quartile | 615 | 767 | 765 | 3,3 | 4,0 | 3,0 | ||
| Sales prices / Rents | €/m2 | median | 743 | 985 | 902 | 7,1 | 5,8 | 6,2 | |
| €/m2 | 3.quartile | 1.063 | 1.238 | 1.243 | 10,4 | 8,7 | 10,0 | ||
| Area | m2 | median | 60 | 110 | 87 | 67 | 56 | 131 | |
| Year of construction | year | median | 1964,5 | 1990 | 1967 | 1981 | 1993 | 1995 | |
|
Coastal Region |
|||||||||
| Number of contracts | 14 | 11 | 8 | 38 | 32 | 25 | |||
| Total sold/rented area | m2 | sum | 3.800 | 500 | 300 | 6.100 | 2.400 | 1.200 | |
| €/m2 | 1.quartile | 1.226 | 1.441 | 2.164 | 6,1 | 9,6 | 8,6 | ||
| Sales prices / Rents | €/m2 | median | 1.647 | 2.049 | 2.432 | 9,1 | 11,4 | 10,3 | |
| €/m2 | 3.quartile | 2.102 | 2.764 | 2.846 | 13,0 | 15,9 | 15,1 | ||
| Area | m2 | median | 81 | 29 | 29 | 45 | 33 | 31 | |
| Year of construction | year | median | 1988 | 1900 | 1980 | 1901 | 1900 | 1900 | |
| Source: own calculation, Trgoskop | |||||||||
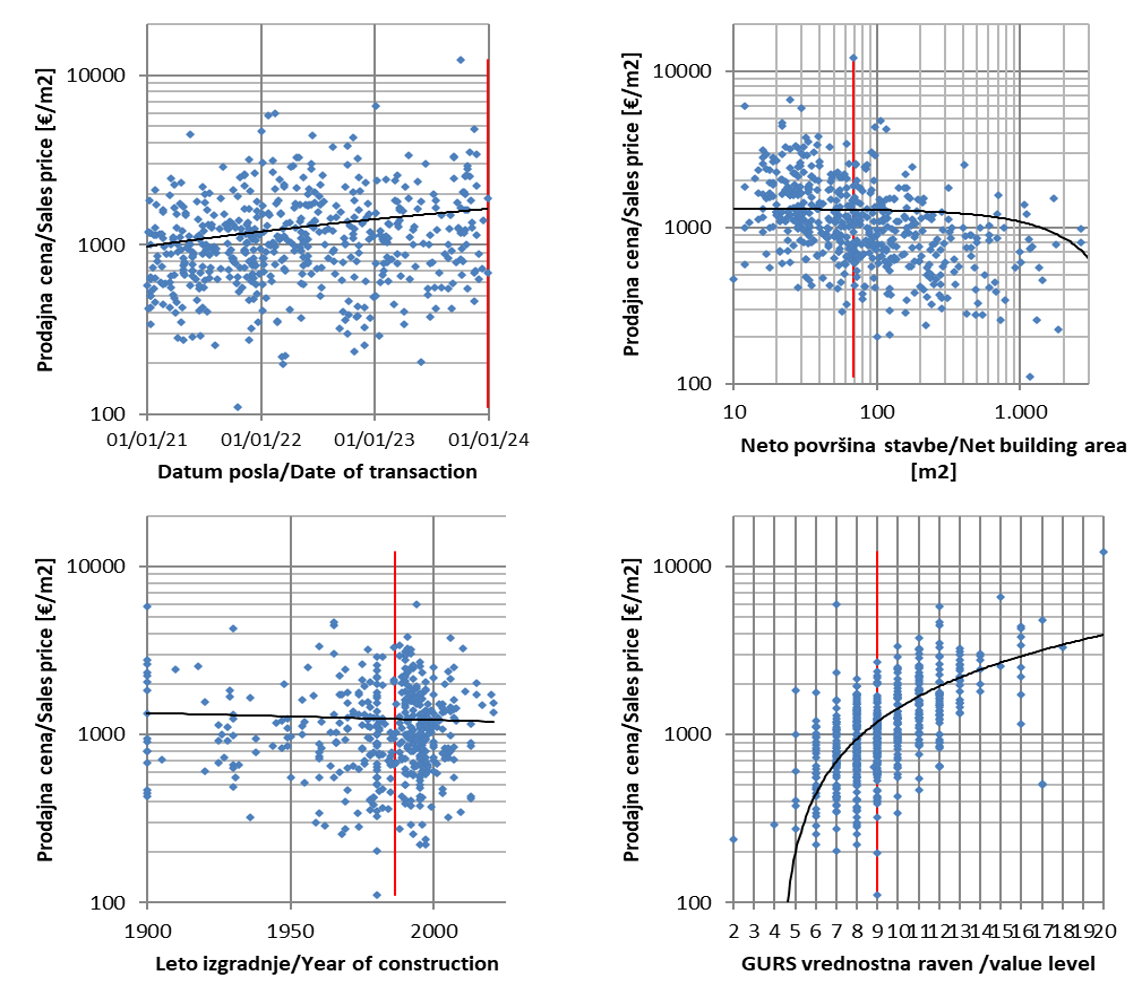
Sales
The volume of transactions with retail premises in Slovenia fluctuates greatly. Years ago, a large number of reatil areas changed hands. In 2023, traffic with retail premises slowed down to slightly more than 100 deals, or 14,000 m2 of surfaces. It was mostly about smaller areas, approx. 70 m2 built in the 80s of the last century. Transactions with reatil premises is evenly distributed throughout the entire territory of Slovenia (in Ljubljana, for example, less than 20% of the areas are sold). The median sales price is €1,143/m2, in Ljubljana €1,810/m2 and in Maribor €902/m2. Sales prices are therefore highly dependent on the location of the real estate. In 2023, the prices of retail areas fell by 4%, compared to a price increase of 9% in 2022.
No sales of larger reatil areas / shopping centers over 1,000 m2 were recorded in 2023. The largest deal was the sale of 68 m2 reatil space on Čopova Street for €840,000.
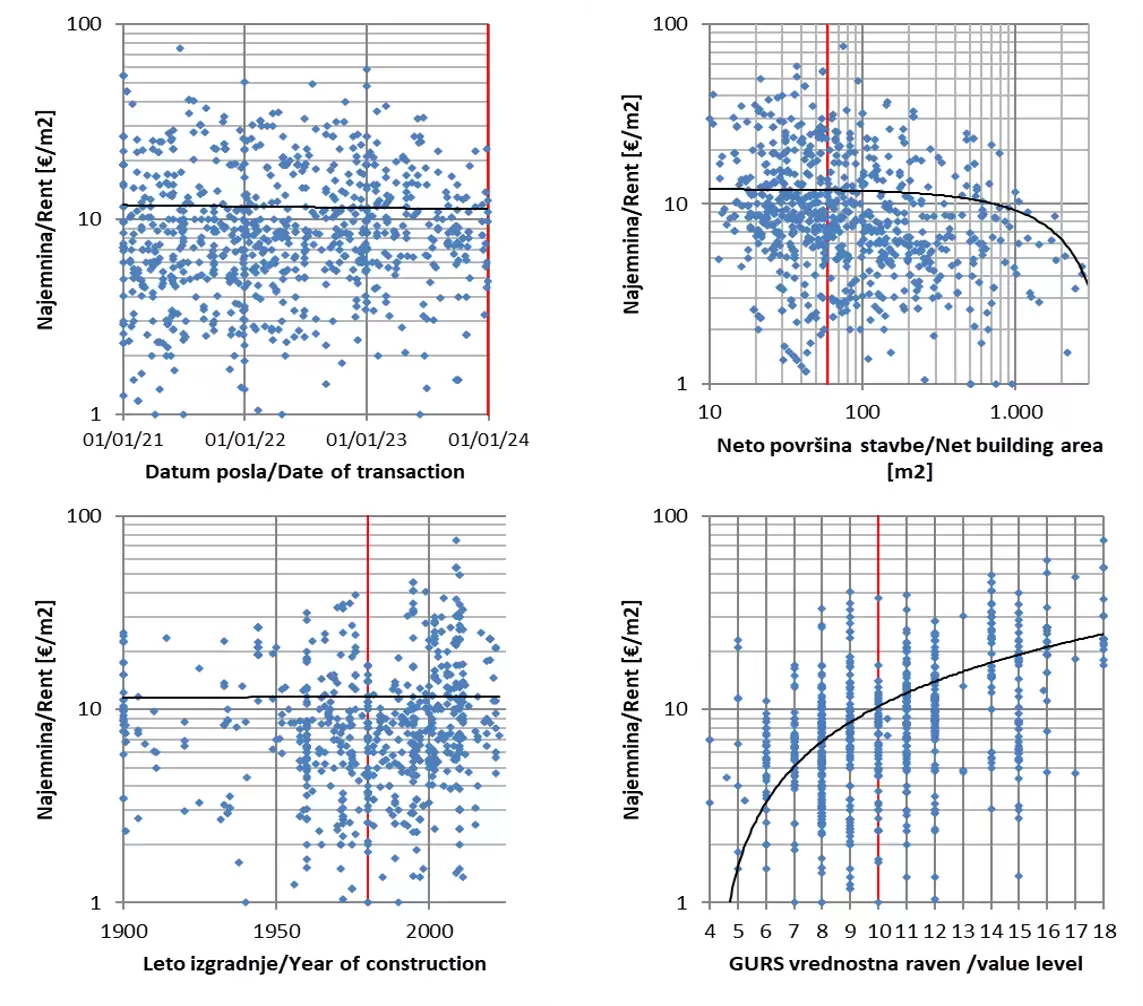
Rentals
In Slovenia, between 200 and 300 rental contracts with retail premises are registered annually, mainly with smaller premises of 60 m2 from the 1980s. Rents of retail premises are uniformly distributed throughout the country. The median selling price is €9.0/m2, but the spread is very large (from €6.5 to €13.8/m2) depending on the location and the leased area. The statistical growth of rental prices for reatil premises reached 12% in 2023 and 2022.
7 larger premises over 1,000 m2 were leased in 2023. The largest leasing transactions were the lease of 1,050 m2 of retail space on Kavadarski cesta in Ljubljana at a price of €10.4/m2, the lease of 2,713 m2 of reatail space in Maribor (Ulica Veljka Vlahoviča ) at a price of €4.5/m2 and a 480 m2 area for rent in the center of Nova Gorica (Bevkov trg) at a price of €24.7/m2.
Graphical presentation of sales transactions
Graphical presentation of rental transactions